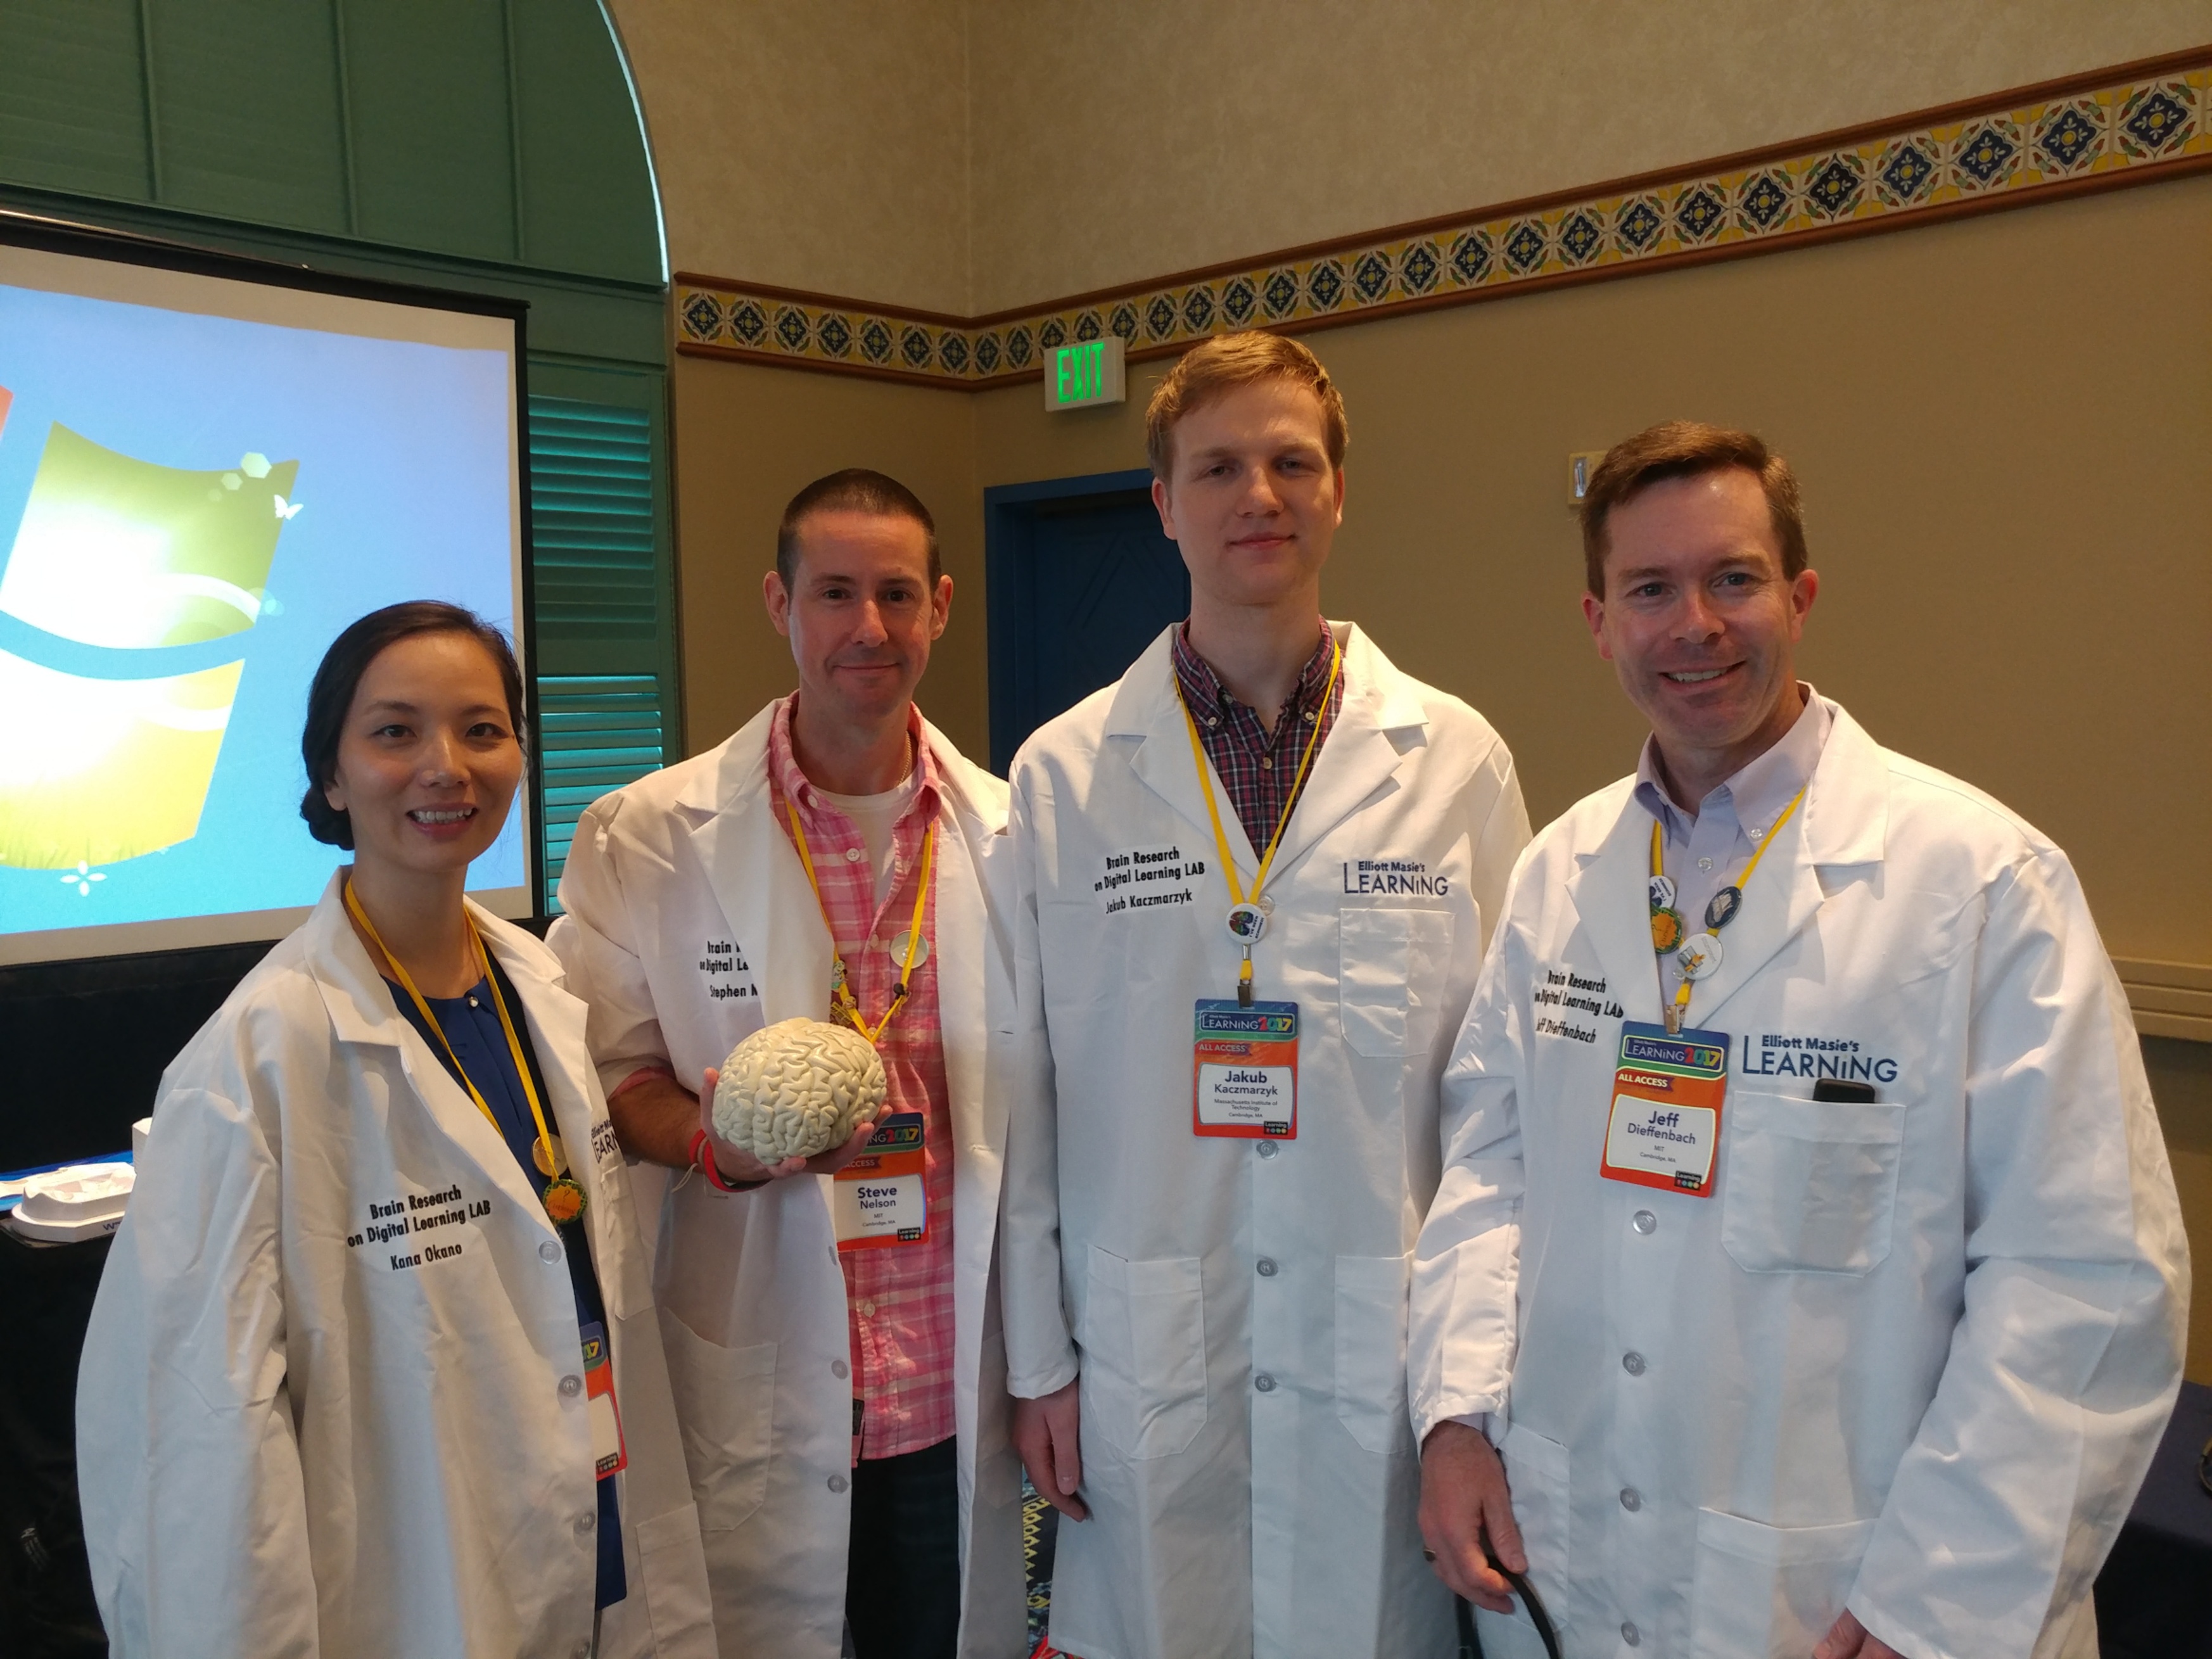
With the help of 150 Masie Learning 2017 conference participants, an MIT research team set out to address the hot topic of micro-learning. The participants interacted with one of three variations of an elearning video on one of the conference themes, cybersecurity. The MIT team used EEG headbands to measure attention during the learning experience and a post-test and survey the next day to capture knowledge gained. Read on to learn about the findings … and how eating habits correlate to those findings.
Subscribe to our newsletter or follow / like us:
![]()
![]()
![]()
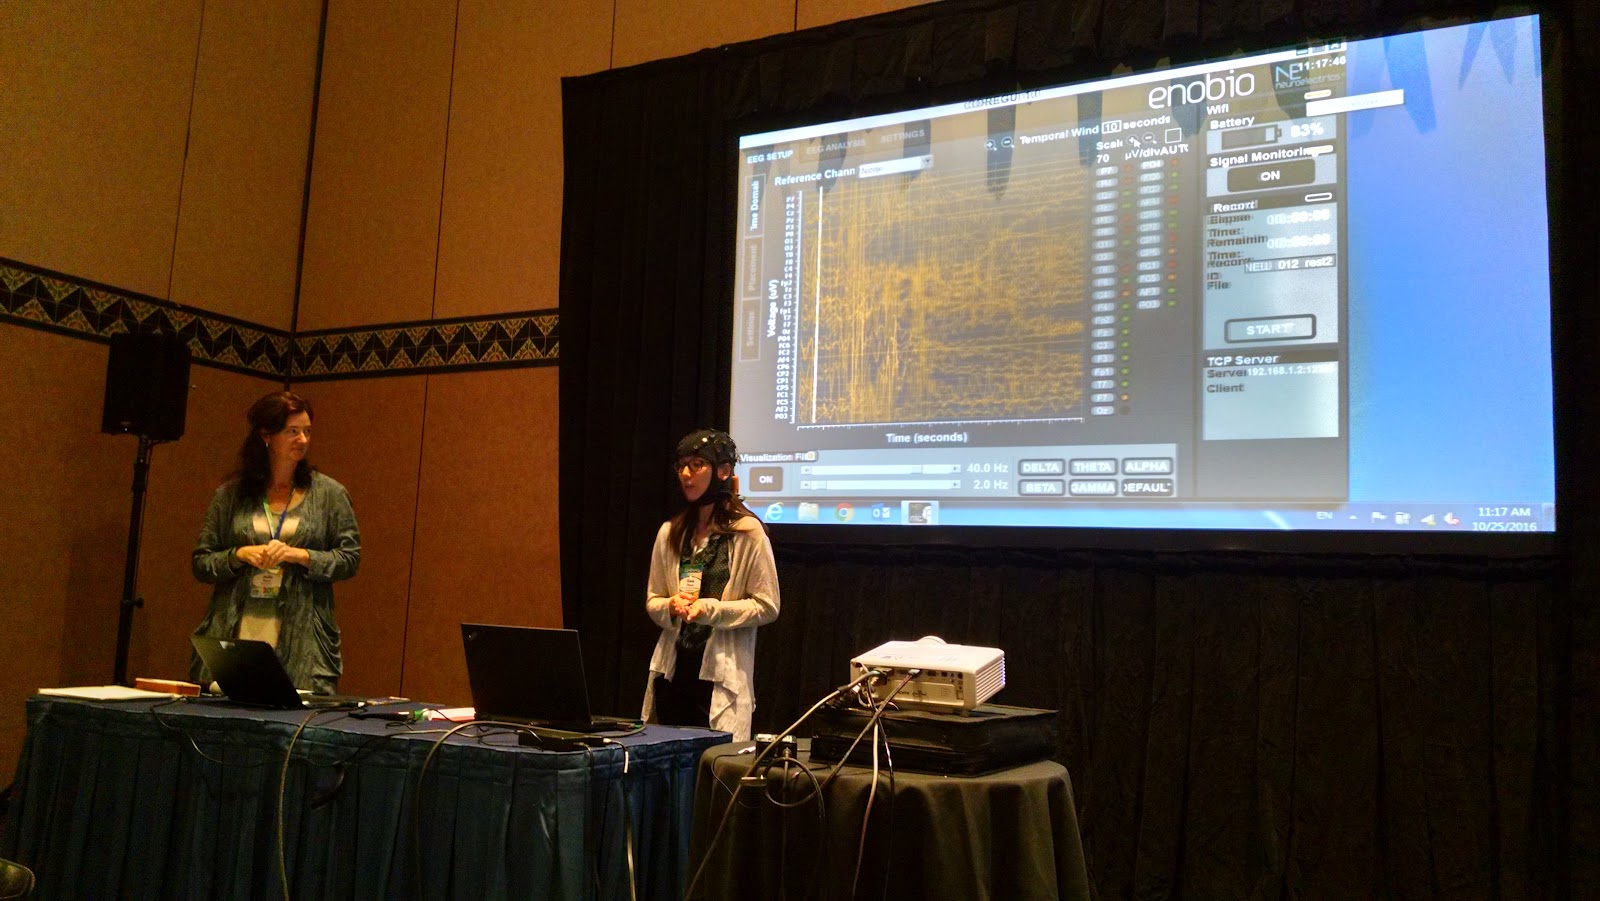
The research project built out of MIT’s participation at Masie Learning 2016. MIT Vice President of Open Learning Sanjay Sarma joined conference host Elliott Masie on stage for a keynote conversation. Elsewhere at the conference, MIT Gabrieli Lab post-doctoral researcher Kana Okano demonstrated the use of an EEG (electroencephalography) device to measure attention and reported on findings of a related research study sponsored by a global consulting firm.
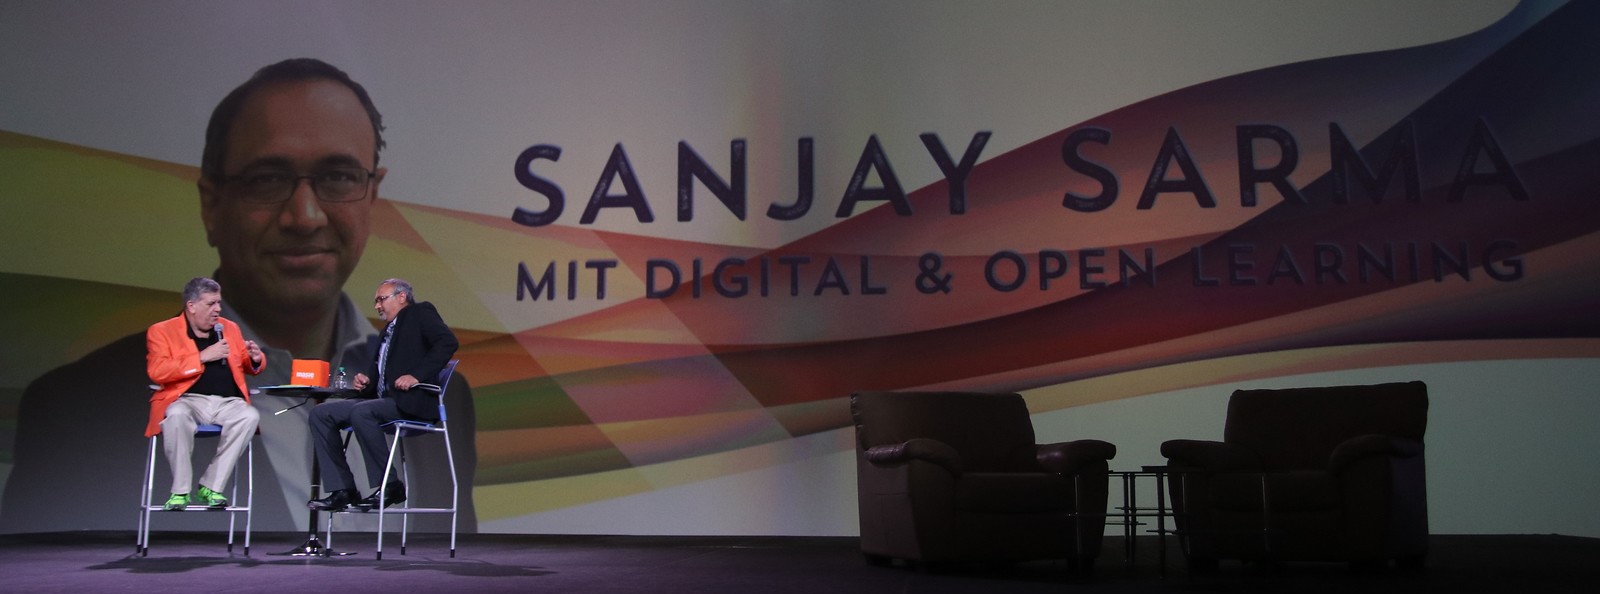
Elliott Masie and Dr. Sanjay Sarma [credit: Masie]
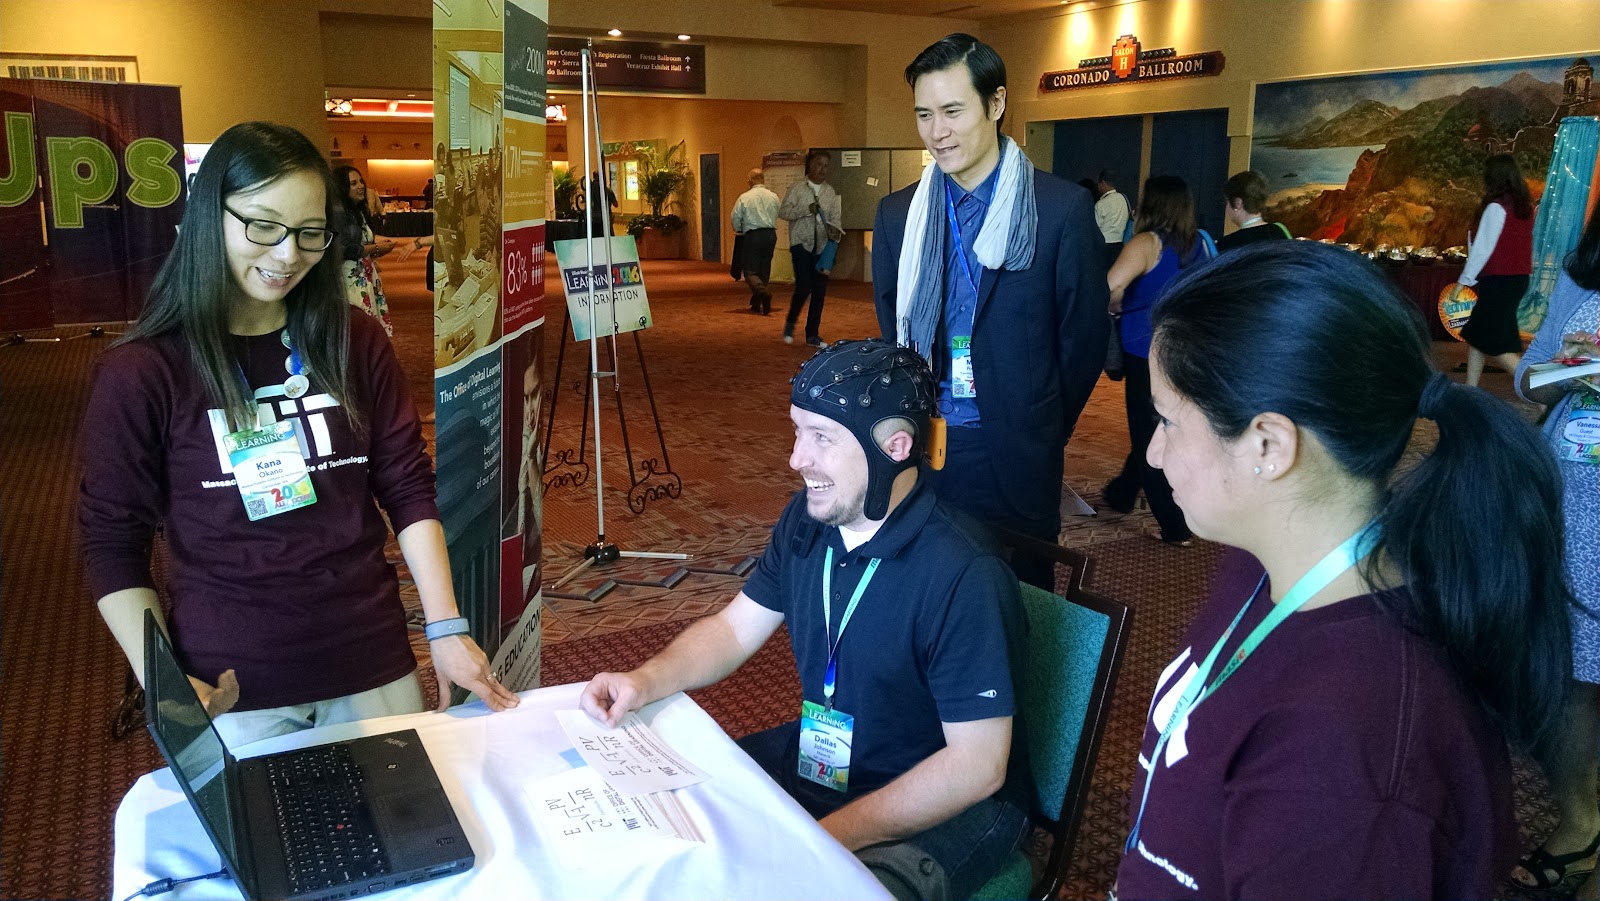
Dr. Kana Okano demonstrates the EEG cap [credit: Masie]
Dr. Okano and a consulting firm representative share research results
Following on the success of the 2016 conference, Masie and MIT met this past summer to plan a more ambitious project--conducting a large-scale learning experiment with participants at the 2017 edition of the conference.
The 2017 Learning Experience
Taking a cue from one of the conference themes, cybersecurity, the MIT team created three elearning video variations: “Original” (the original 8-minute video), “Interrupted” (the same content as Original, but interrupted three times with short unrelated work tasks), and “1.5x” (the same content as Original, but increased to 1.5x the speed of the Original video.
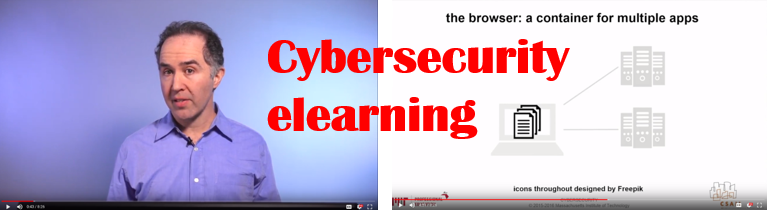
Cybersecurity elearning video
To measure learning effectiveness, participants anonymously (1) wore EEG headbands that captured brain electrical activity associated with attention/mindfulness and (2) completed a post-test the next day. Post-tests and surveys were administered the next day rather than immediately following the learning experience because research shows that results collected a day later are a better indicator of longer-term retention.
Participants also completed a survey asking for information about their age range, native language, familiarity with cybersecurity, relevance of cybersecurity to their job, importance of cybersecurity as a topic, interestingness of cybersecurity as a topic, interestingness of the specific video, and mindfulness.
Experiment Configuration
At the conference, the experiment was configured as follows. At registration on Sunday, participants had the opportunity to sign up for one of eight identical research sessions. Participants also learned about the research project at the opening session Sunday evening and through signage around the conference.

Notes from the Sunday opening session
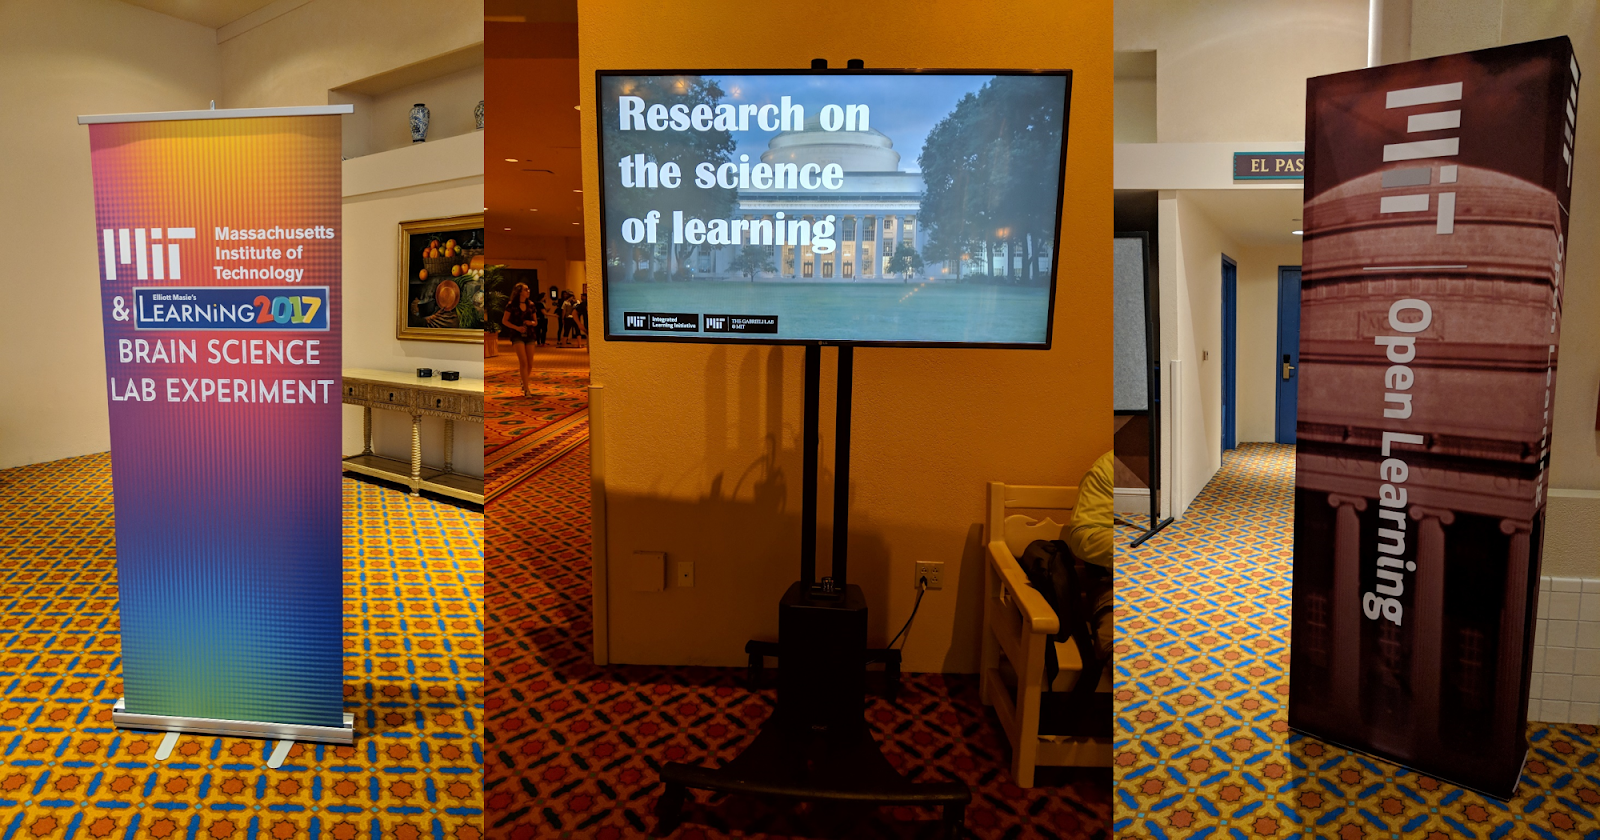
Research experiment signage around the conference
Over the course of Monday and Tuesday, the two full days of the conference, the MIT team ran a total of eight research sessions: early morning, late morning, early afternoon, and mid-afternoon. On Tuesday, the Monday experiment group took the post-test and survey; the Tuesday experiment group did the same on Wednesday. Finally, the MIT team presented preliminary findings at the closing session on Wednesday.

Overall research experiment configuration
Room Setup
The experiment was conducted in a dedicated room. The room held 20 stations each consisting of an EEG headband, a tablet to show the video, and a set of disposable headphones. Each session of 20 participants included a mix of the three video types: Original, Interrupted, and 1.5x.

Representative research station

Room configuration: left, during instructions; right, during experiment
Findings
With eight sessions of twenty stations spread over the two days, the experiment had a capacity of 160 participants. Registration was oversubscribed, with as many as 30 people interested in the 20 seats for some of the sessions. That oversubscription was not spread evenly, however--the experiment ended up with 74 participants on Monday and 77 on Tuesday for a total of 151. Of the 151 participants, 129 (85%) completed the post-test.
The MIT team presented preliminary findings during the final general session of the conference.
Dr. Okano and team member Jeff Dieffenbach present preliminary findings
The detailed findings below draw on additional results and analysis captured after the preliminary presentation at the conference.
First up, a comparison of how post-test score varied by video type: Original, Interrupted, and 1.5x. The mean scores of the Original and Interrupted cases are essentially identical, with the 1.5x case trailing by a bit. However, the differences are not statistically significant--that is, none of the three variants can be said to have outperformed the others (the error bars represent the standard error of the mean).
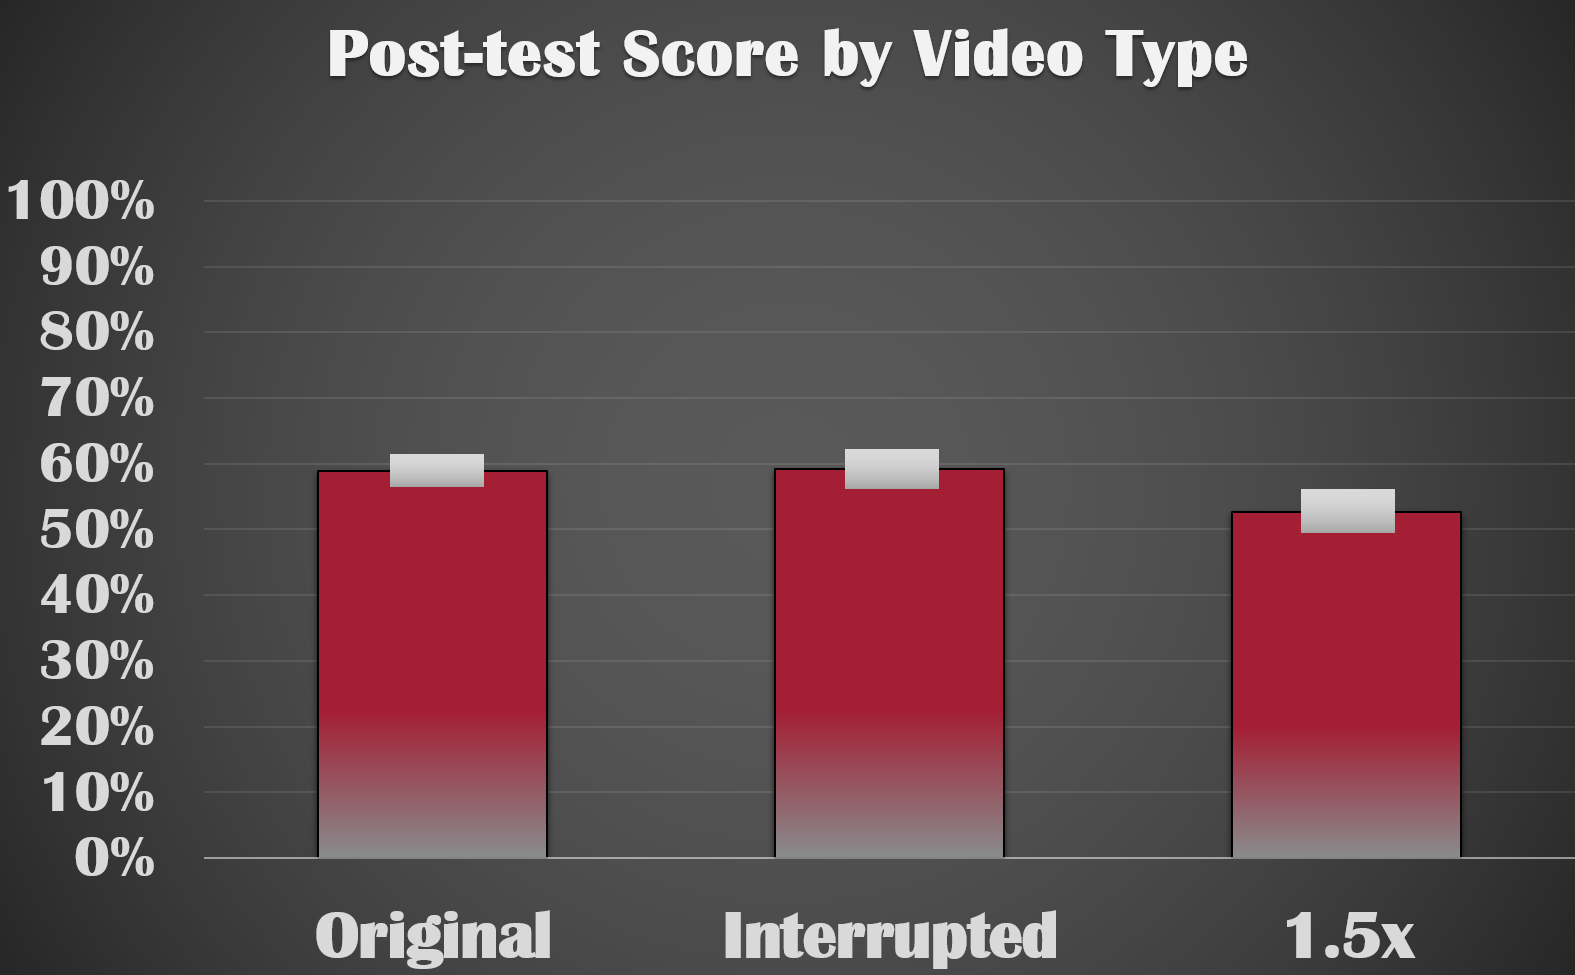
Post-test score by video type
More precisely, upon conducting an Analysis of Variance (ANOVA) using video type as the independent variable and post-test score as the dependent variable, there is no significance difference of learning effectiveness across the three video types (F (2,126) = 1.60, p = 0.21). The standard errors of the mean are: Original = 0.261; Interrupted = 0.308; and 1.5x = 0.314.
What might have accounted for the lack of statistically significant difference across the three video types? It’s possible that the differences simply didn’t matter. It’s also possible that the particularly motivated group of learning and development professionals at the Masie conference paid more careful attention than would have a representative workplace learner, especially knowing that the learning experience was going to be relatively short. Regarding the 1.5x group, outcomes may have been affected by the participant not having the option of selecting video speed.
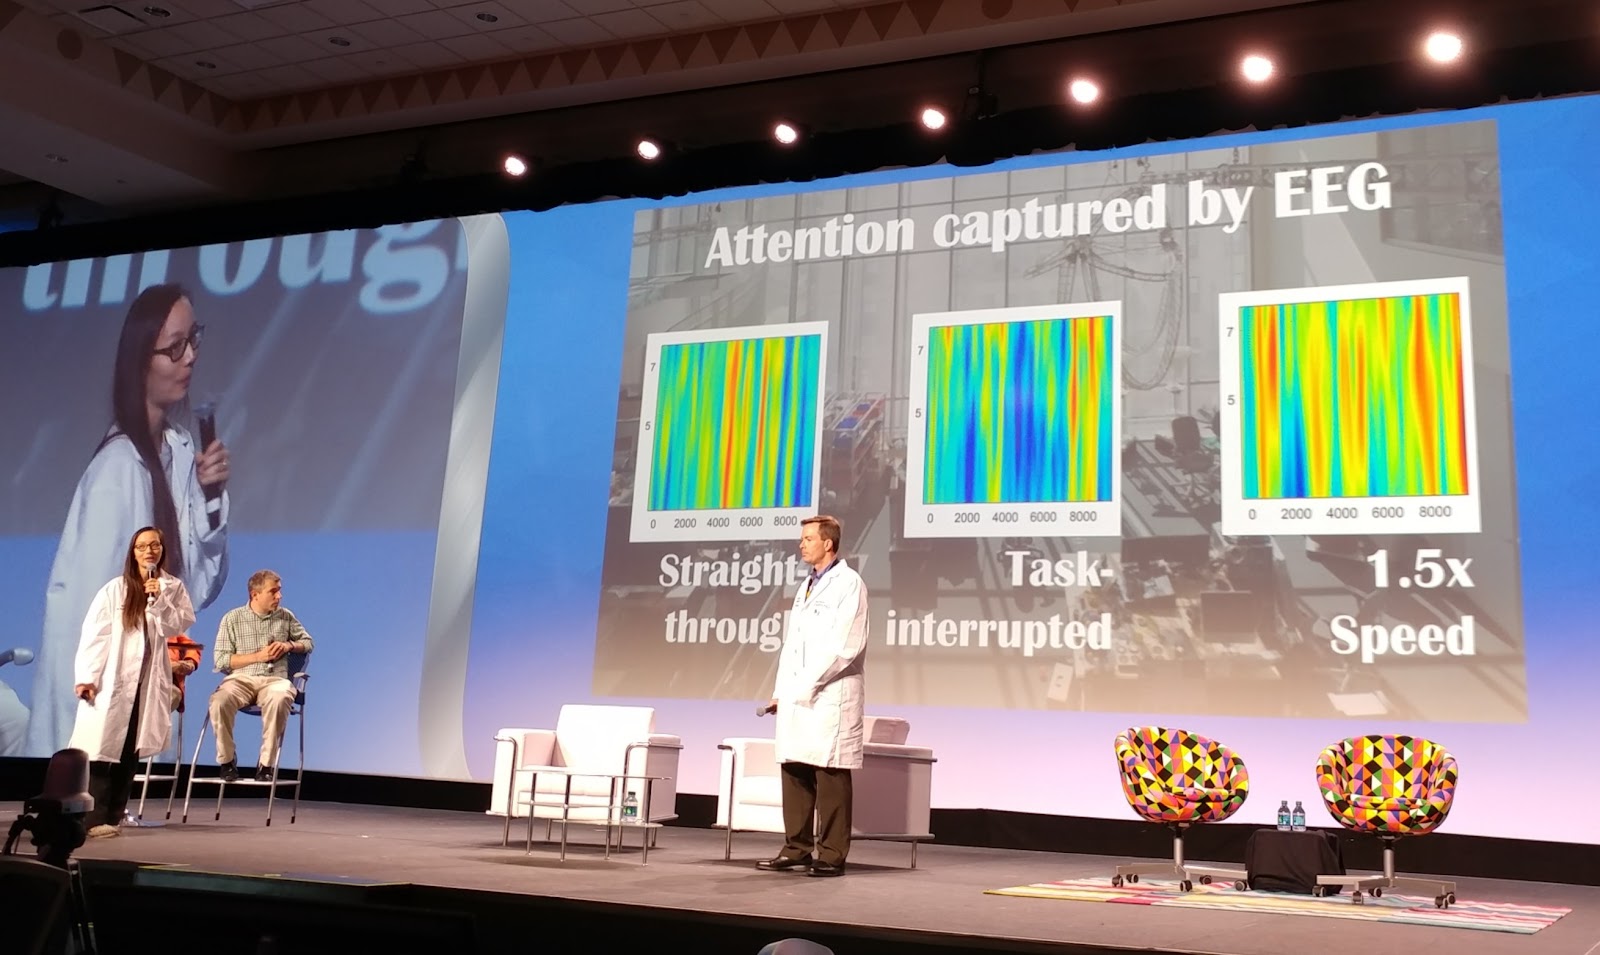
The EEG plots are consistent with the post-test finding. In the images below, colder colors (blues, greens) are indicative of attention. In contrast, warmer colors (reds, oranges) show mind wandering. The three images reflect typical attention for the three video types: more attention for Original, moderate attention for Interrupted, and less attention for 1.5x (statistically not significantly different when correcting for multiple comparisons).
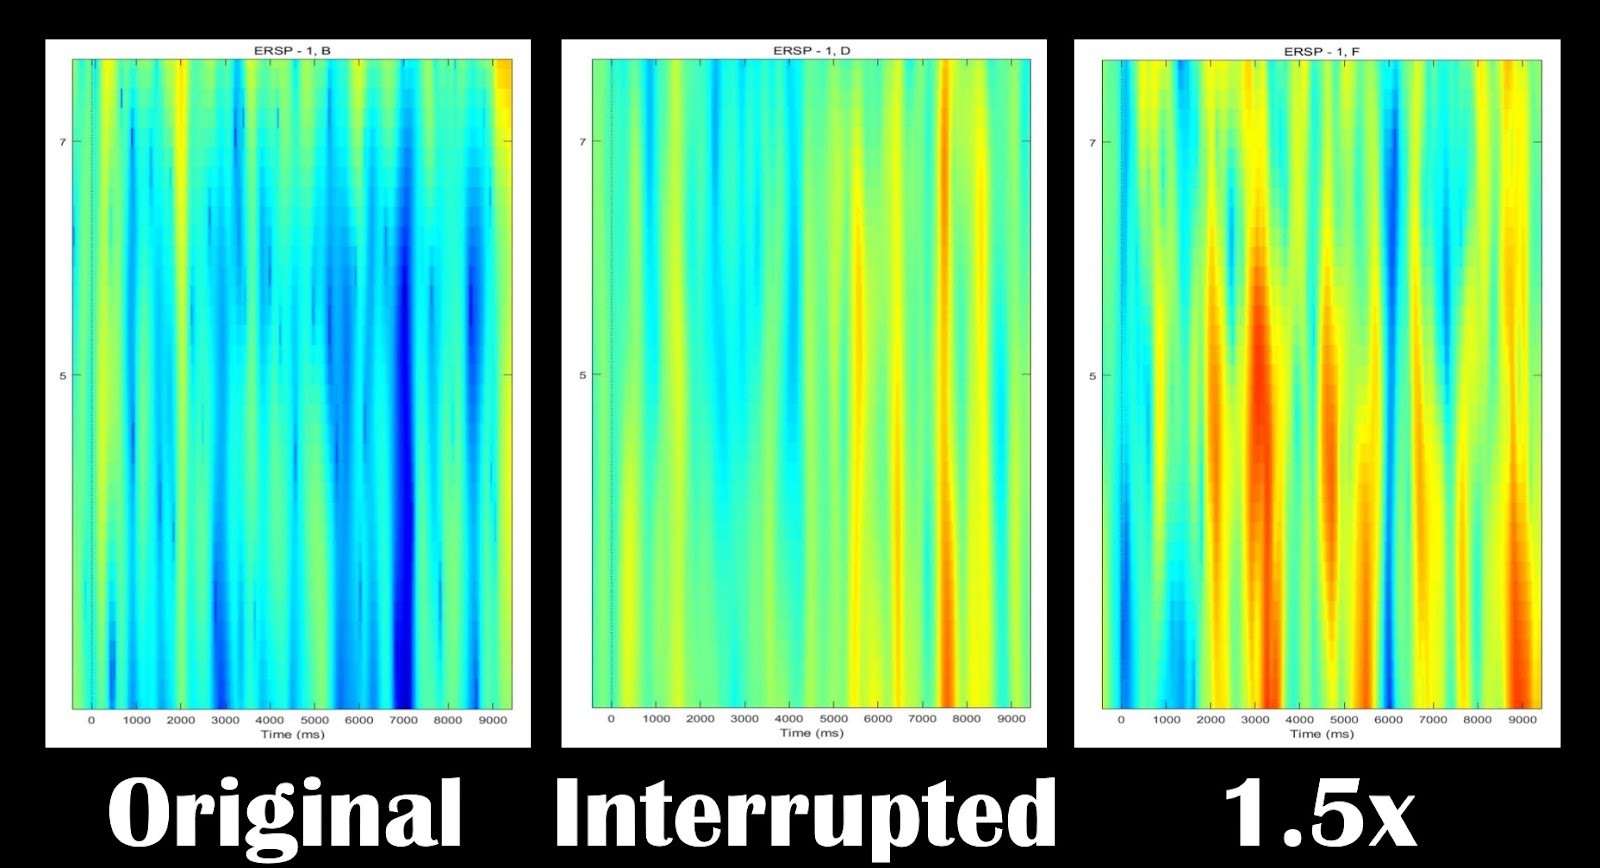
Representative EEG image by video type
Next, a comparison of how post-test score varied by time of day: early morning, late morning, early afternoon, and mid-afternoon. The mean scores of the late morning case are the highest, with the early morning scores the lowest. The two afternoon means fall in the middle. The difference between the late morning and early morning scores are statistically significant, but the differences between late morning and both afternoon scores and between both afternoon scores and early morning are not (the error bars represent the standard error of the mean).
An ANOVA on the four different times of day as the independent variable and post-test scores as the dependent variable revealed a significant difference among the four times of day (F (3,125) = 3.94, p < 0.05), where the Late AM group significantly outperformed the Early AM group. All other contrasts were not significantly different as revealed by a post hoc test (all ps > 0.21). The standard errors of the mean are: Early AM = 0.315; Late AM = 0.340; Early PM = 0.297; and Late PM = 0.363.
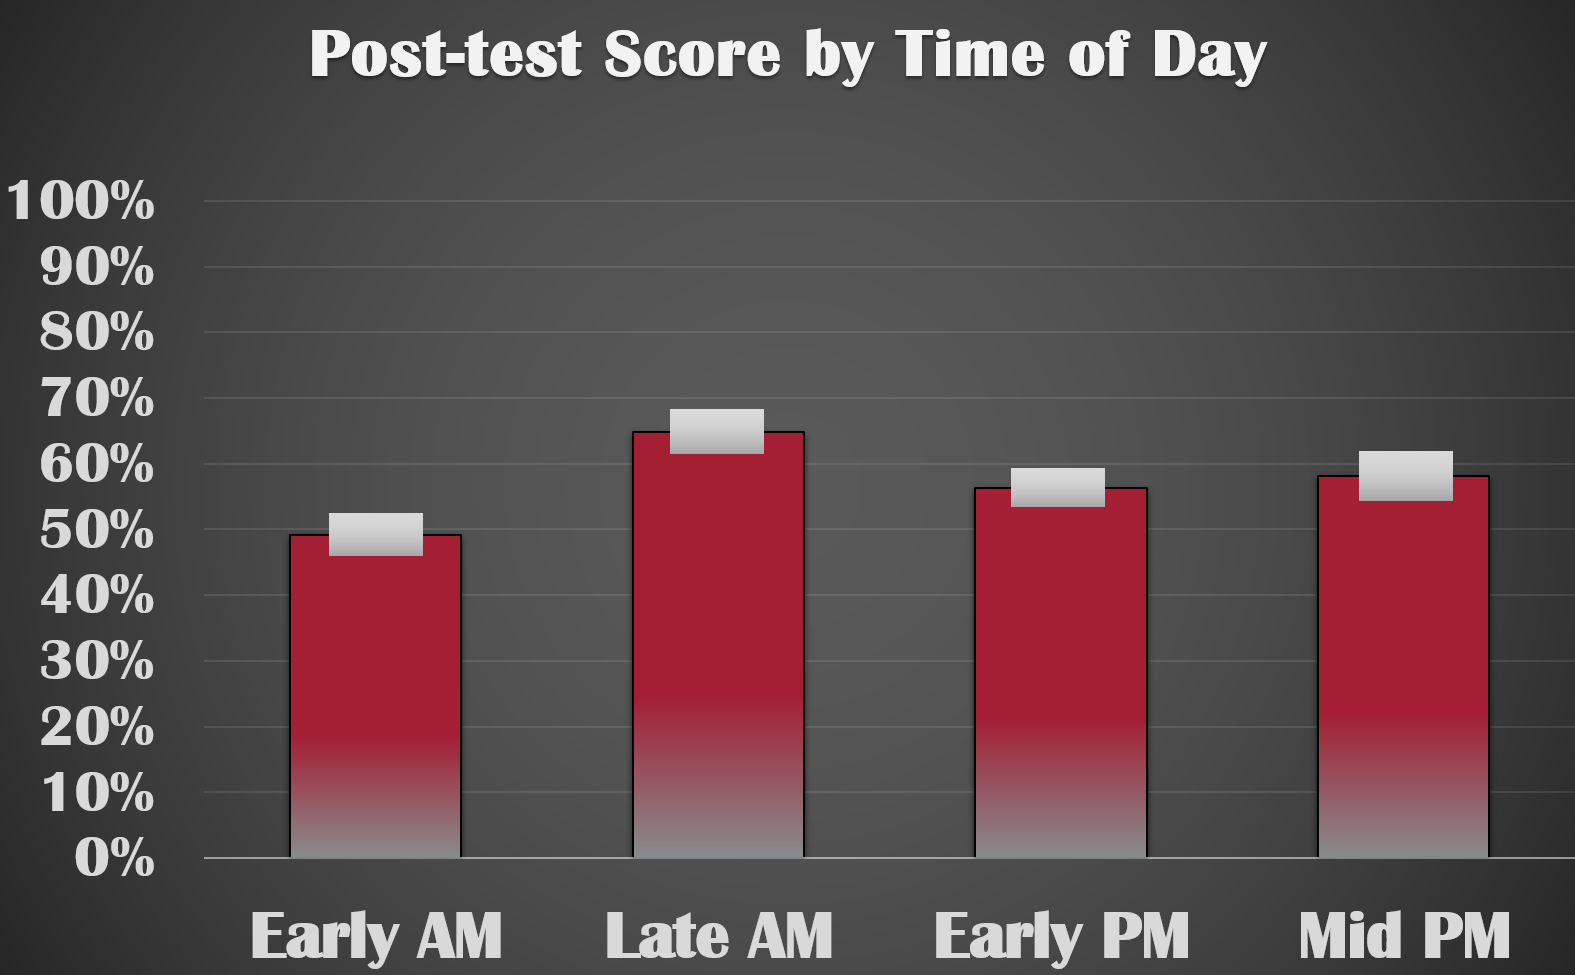
Post-test score by time of day
Although the EEG plots are not entirely consistent with the post-test findings, we again find that the group that performed the best show most attention relative to other groups. Again, in the images below, colder colors (blues, greens) are indicative of attention. In contrast, warmer colors (reds, oranges) show mind wandering. The four images reflect typical attention for the four time-of-day slots: more attention for Late AM followed by Early AM, Early PM, and Mid PM.
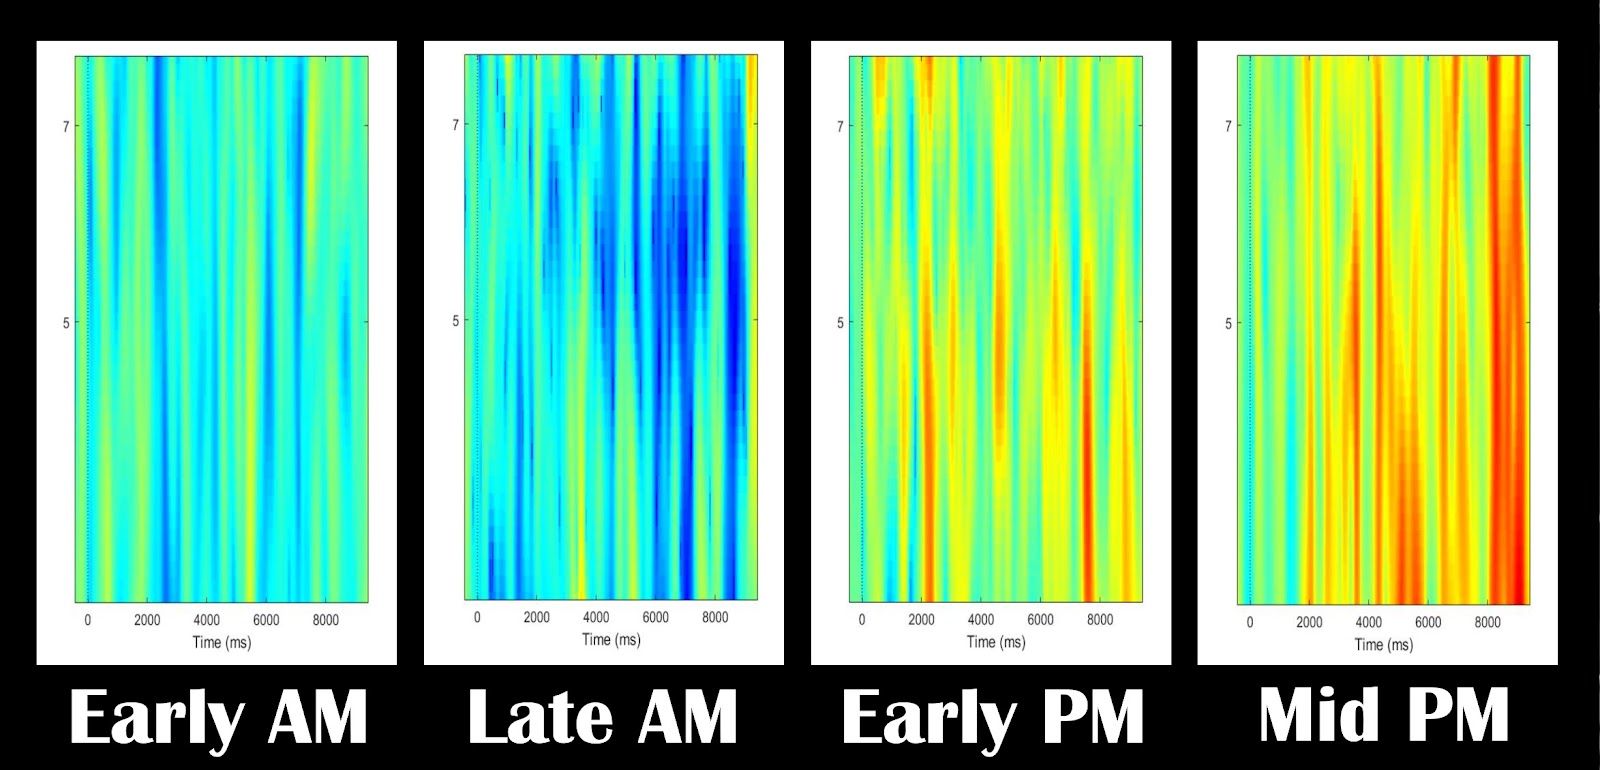
Representative EEG image by time of day
What about the comment in the introduction regarding eating habits? As part of the survey that accompanied the post-test, participants answered a number of questions about their own particular mindfulness: frequency of “running on automatic,” pre-occupation with past or future, and so on. Of those questions, only one had a statistically significant correlation with post-test score.
Participants who more positively responded to “I snack without being aware that I'm eating” tended to score lower on the post-test than those who responded less positively (r(129)=0.27, p < 0.005). Want to improve your learning? Lock those chips, cookies, and other snacks away.
You can listen to MITili's Jeff Diefenbach and Kana Okano talk about the research here, and see them present early results here.
Subscribe or like / follow us:
![]()
![]()
![]()