With the help of conference attendees as research participants, MIT’s Integrated Learning Initiative (MITili) conducted an experiment at MPI’s 2018 World Education Congress in Indianapolis to address the extent to which video improves learning outcomes relative to reading.
The Experiment
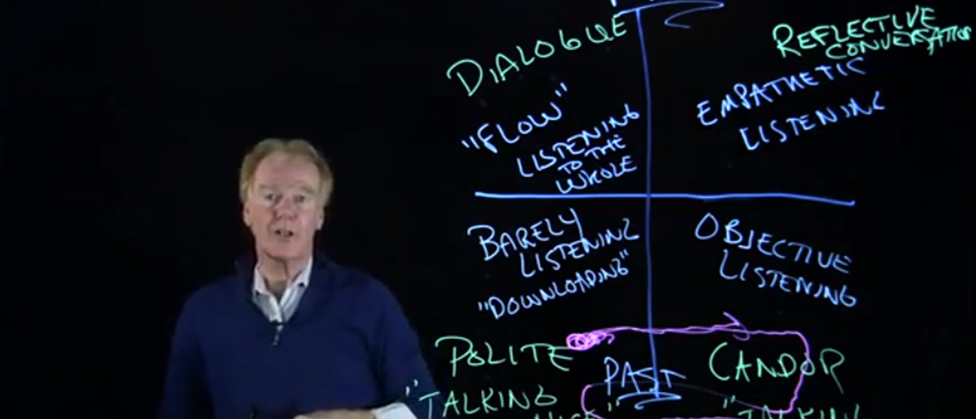
Participants were asked to sign up for one of two research sessions and were then split into one of two learning groups. One group watched a video of MIT Senior Lecturer and Fifth Discipline author Peter Senge, while the other read a transcript of that video accompanied by diagrams. The material covered in both forms was on the “Four Fields of Listening,” a popular online lecture. The hypothesis was that not only would most people prefer to watch the video, but that those who watched the video would score significantly better on a post-assessment.
Participants were asked to complete a short survey and post-assessment the morning after their learning. (Research shows that retention a day after learning is a reliable indicator of long term retention.)
We asked participants about their preferred method of learning: video, lecture, reading, or other. Perhaps surprisingly in an era of video, the survey revealed that roughly 30 percent preferred reading, 30 percent preferred lecture, 20 percent preferred video, and another 20 percent preferred another form of learning (including hands on and interactive learning).
Did Video Fare Better Than Reading?
The following differences were not found to be statistically different based on the number of study participants tested.
Post-Test Scores
- Video
- Average: 81.3%
- Median: 80.0%
- Reading
- Average: 82.5%
- Median: 90.0%
However, the experiment revealed some interesting insights into the participants’ physiological readiness to learn. In the survey, participants were asked about several factors that may influence learning effectiveness: amount of sleep the night before, the number of adult beverages consumed the night before, and the amount of time that had passed since their last formal classroom learning.
Sleep Tight!
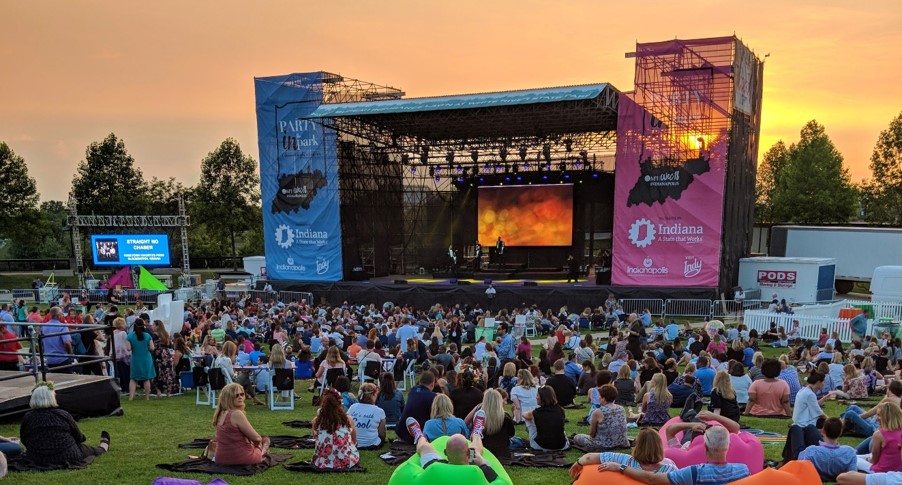
Over 60 percent of all participants had six or fewer hours of sleep the night before the research was conducted (that was the night of MPI’s excellent party at White River State Park).
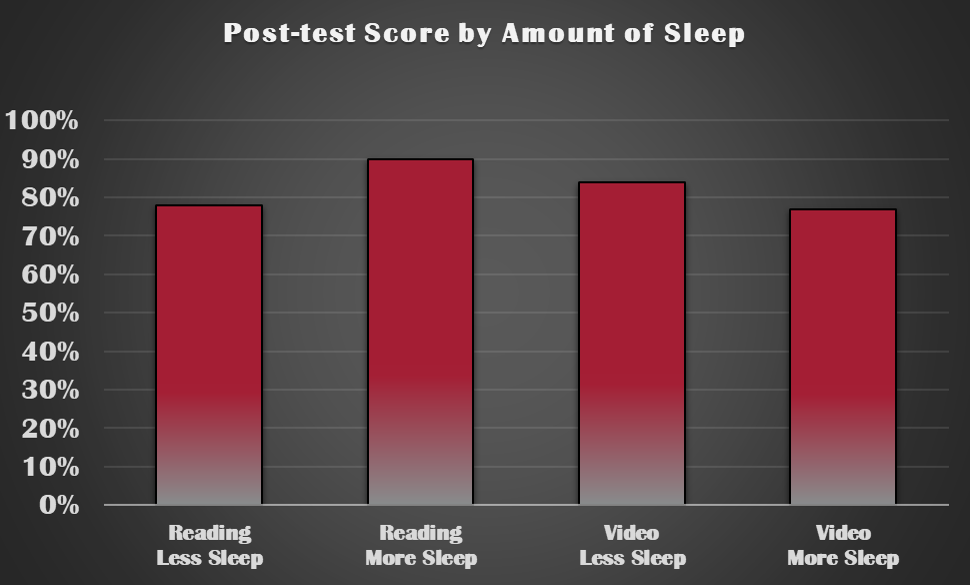
For the reading group, lack of sleep had a slight disadvantage: those having six hours or less of sleep scoring on average 12 percent lower on the assessment. However, sleep deprivation didn’t have the same impact on the video learners as the readers. In fact, the sleepy group outperformed their counterparts by nearly 7 percent on the assessment. Again, in both cases, the differences were not statistically significant.
Meeting Planners Enjoy a Good Party
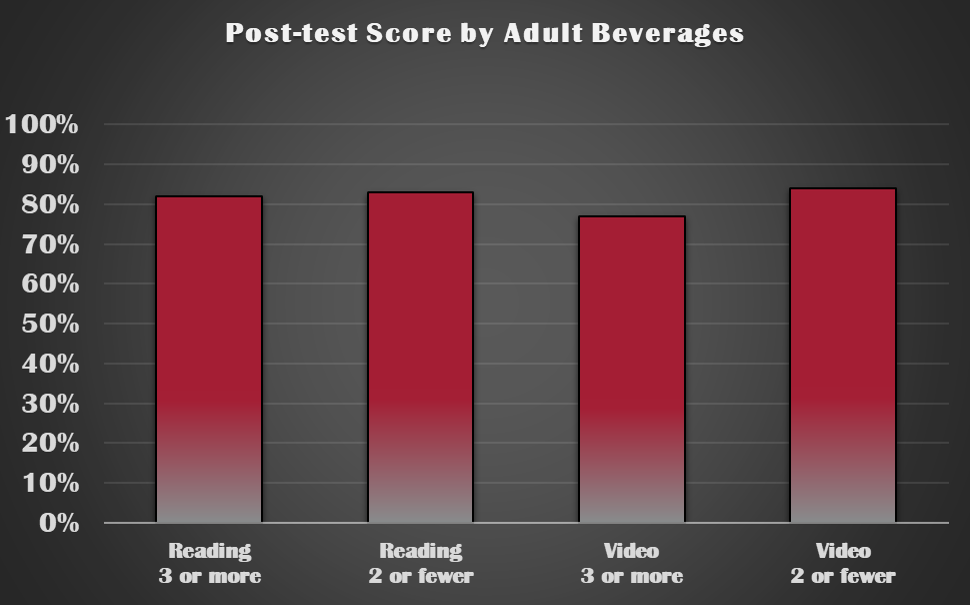
Nearly half of the participants reported having at least three or more alcoholic beverages the night before the learning sessions, and only 12 percent of the participants reported having nothing at all to drink. Again, because the results do not vary much, we can’t say with statistical significance that drinking had a significant impact on the learning.
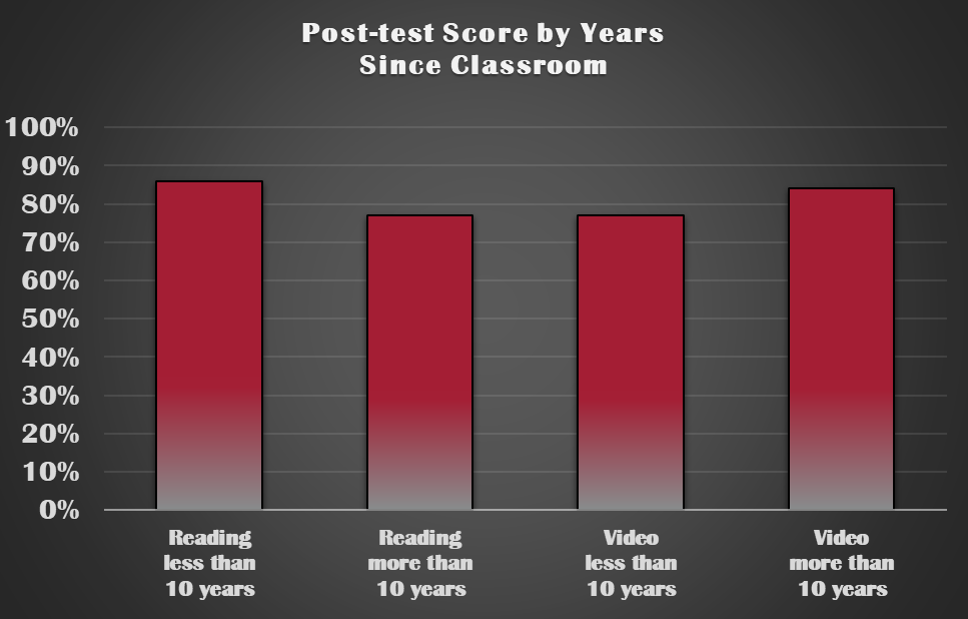
When’s the last time you saw the inside of a classroom?
As can be seen from the graph below, those in the reading group with more recent classroom learning did slightly better (9 points), but in the video group there was an opposite effect with the learners without the advantage of recent classroom experience actually scoring better (7 points). The same lack of statistical significance still holds. The hypothesis being that those with more recent formal learning would score better in attending a formal learning experience.
It should also be noted that participants did not have a choice in which learning session they would attend. Therefore, in several cases those who preferred video were in the reading session and vice versa. This had a slight impact on how they scored against participants in their own session. For example, participants who preferred to watch videos and did watch videos scored 10 percent higher than those who preferred to watch but were asked to read. Likewise, those who preferred to read and did read scored nearly 10 percent higher on the post assessment than participants in the video group who would have preferred to read.
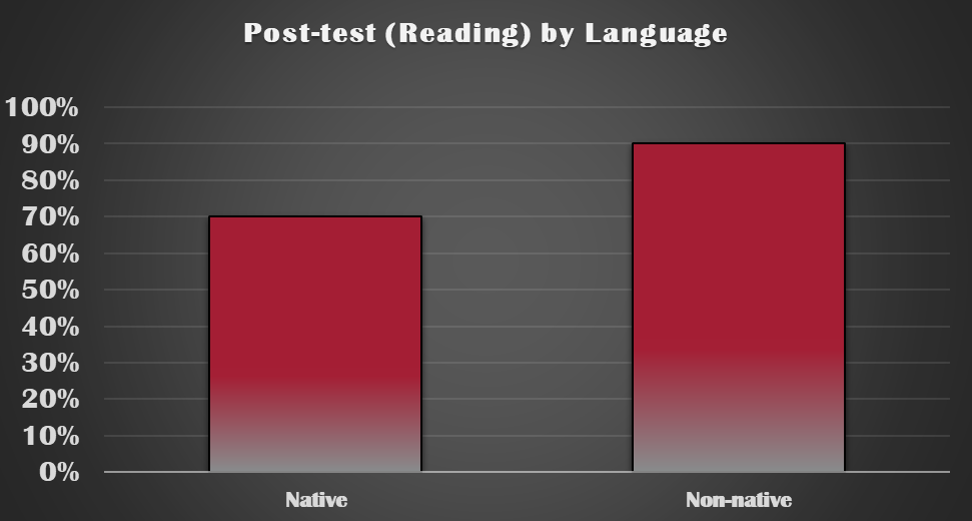
Does Language Play a Role?
We also looked at whether native language played a role in learning. MPI is global and the international participants were particularly strong. The chart below reveals a surprising result. Non-native English speakers (all in the reading group) outscored their native-English speaking counterparts on the reading assessment by twenty percentage points. Our hypothesis would have been that native speakers would have had an advantage.
Conclusion
In formulating our research strategy we had several hypothesis including the factors mentioned in this report. However, often times in scientific research those hypotheses aren’t supported. In that case we look to do something different the next time, whether it’s a different experiment, different participants, or formulating a new hypothesis entirely.
Finally, one extremely important factor was that participants knew there would be a post-learning assessment so they were all very attentive during the learning exercise. This factor may have led to better assessment scores overall.